
– Harsha Pai, Head of Engineering @ Chai Point
We at Chai Point have been at the heart of the chai-led beverage revolution in India for more than 10 years now. Serving over 7 lakh cups per day and fulfilling more than 100 million cups delivered over the past year, our omnichannel network of physical stores, cloud kitchens, virtual stores, 3rd party vending sites at offices, F&B players etc. make us the largest chai-led beverage platform in the world.
Our aspiration is to reach a scale of 60,000+ distribution points and achieve a daily cup count of 10 million beverages.
Aspiration of this scale is only possible through deep investments in our cloud connected brewing systems.
This series of blogs is to share greater details on different building blocks of our technology stack.
If we must build and operate a beverage platform with 60K + distribution points a real time inflow of data into our Network Operations Centre is critical. This data needs to be overlayed by a machine intelligence layer to generate the vital health statistics of the network.
This is what we hoped to accomplish with our business intelligence solution. Aspects such as machine availability, machine status part by part, consumption data, central recipe calibration, inventory control and alerts, revenue etc. are all something that we wanted to monitor and track in real time. Therefore, the technology that we were building had to eventually cater to two aspects to drive our business at scale:
· Phase 1 to aggregate all data together so that we can report more accurately and efficiently. Data corresponds to everything mentioned above, and more!
· Phase 2 to start developing predictive algorithms using the data. Some use cases that we are looking at are auto indenting, logistics monitoring, revenue and demand forecasting and machine lifecycle management
As you can see, the piece of technology that we were planning to build had to cater to a large and diverse data set which would become the backbone of running our operations for the entire myChai™ Brewing System. This is the story of how we developed the Chai Analytics solution.
Back in 2021 just as the 2nd wave of Covid completed wreaking havoc on the entire nation, our business was on its way to getting back to normal. The quality of resilience in human beings to fight on to have a normal routine cannot be underestimated and this proved to be decisive for us as well. In a country like ours one’s normal routine typically includes the mandatory cup of Chai in the during the day or evening. For us at Chai Point, serving this great cup to our customers is what keeps us going.
Data insights for a retail QSR is as important as it would be for a company in any other domain. One of the problems we had was that we were struggling to get real insights from our data. We had large amounts of unstructured data but our ability to learn from it seemed limited. And as a company focused on Objectives and Key Results (OKRs), we were struggling to measure them with the backing of data insights and analytics.
Thus began our journey to identify & engineer the perfect business intelligence solution – it had to be perfect because we strive to brew the perfect happiness for our customers in every cup that we serve, and it was but natural for us to aspire for perfection in our new solution as well.
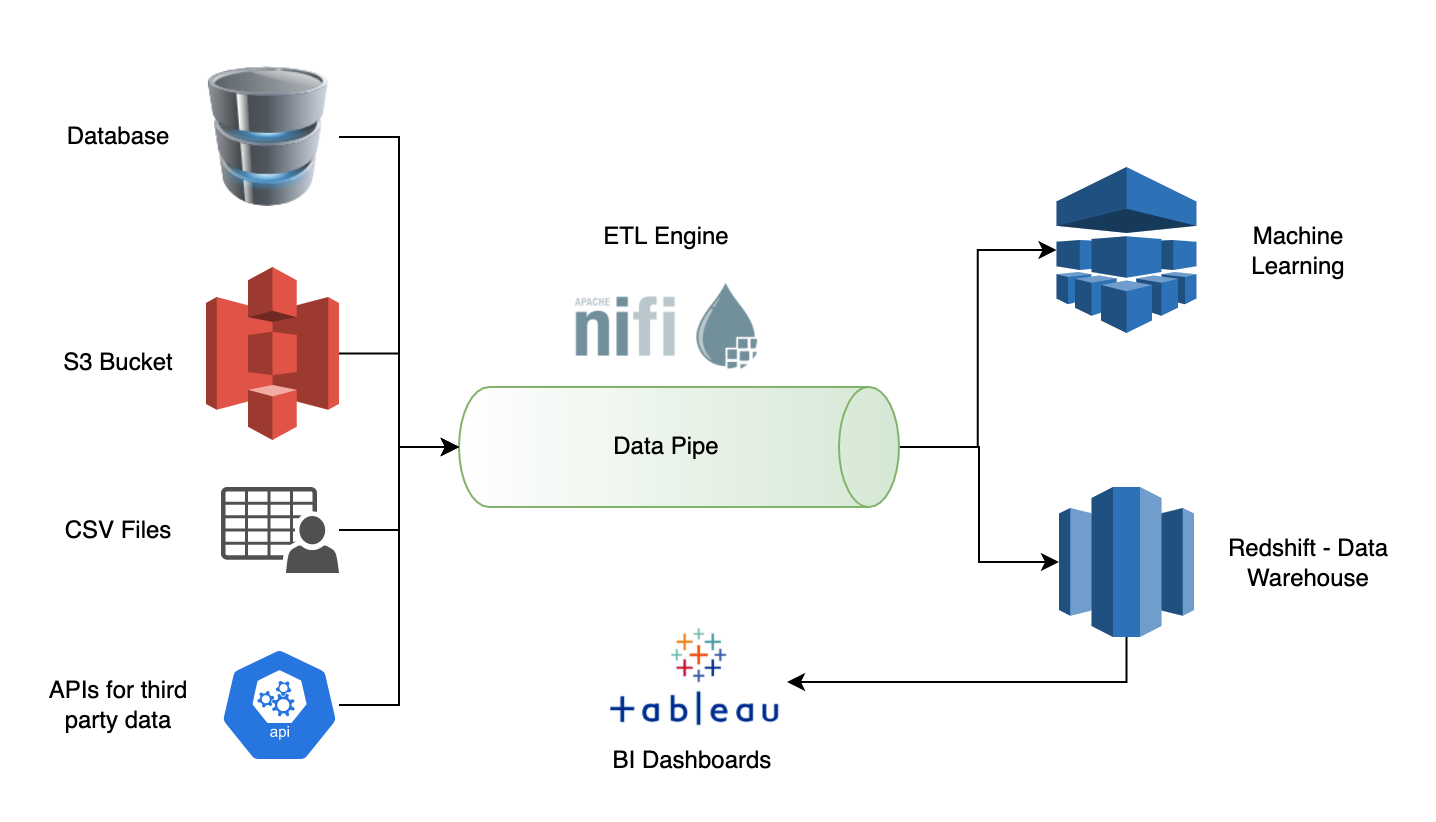
None of us in the Fountain team had engineered a BI solution from scratch – we were all new to the idea and very much excited. Fountain is the name of our tech platform at Chai Point which powers all our business including our state-of-the-art MyChai™ Brewing System. After doing some groundwork, we concluded that we had to identify and finalize three critical foundational components that would become the building blocks of the solution. Each of these components had to work in perfect co-ordination with one another. The three foundational components were:
· The ETL (Extract, Transform & Load) Engine
· The Data Lake or Warehouse
· The BI Visualization Tool
There are several options for each of the above components in the market, each one claiming to be better than the other. Each one highlighting its story of success, showcasing big names that have mastered their way of identifying actionable insights from data. As a team, we decided that we would put more focus on evaluating the technical aspects for the first two components and allow more focus on evaluating the business needs for the third component which was the BI tool. The rationale behind the decision was that the BI tool was the only component to which the business would be directly exposed – they would be oblivious to what happens in the background and if things were running seamlessly, the business wouldn’t really care about the backend engine. In hindsight, this decision proved to be highly useful as were able to work in perfect harmony with the business.
My advice to anyone who is looking to engineer a BI solution is to focus on getting the data engineering aspect right and leave the selection of the BI tool to the business. Most tools out there provide similar features and capabilities and its best for the business to make the decision on which tool to use – Engineering teams should just do a validation check.
Our CFO & Co-Founder Nikunj Gupta was the sponsor of this project, and we were blessed because he had great experience in working with BI tools. It was a no-brainer for us to go with Tableau as the preferred BI tool. Product management along with the business stakeholders did spend time in evaluating other tools as well. Tableau had the following aspects working for us:
- Proven experience, some business users had used it in their previous jobs and were familiar with it
- The ability to build dashboards was fairly simpler
- Licensing and cost were optimal
- Several certified partners of Tableau were readily available to help us out in our dashboard journey
As highlighted earlier, engineers must focus on getting the data engineering part right and that’s what the Fountain team proceeded to do. The two components i.e., the ETL engine and the data lake play a critical role in the solution. Before we started to look at options, we came up with evaluation criteria for both components. We wanted to evaluate each option against these criteria and let the output of the evaluation make the decision for us.
For the ETL engine, we were clear in our minds that we wanted to go with an open-source tool. The reason was that ever since big data became a household name, open-source tools had been at the forefront of transforming big data and making the engineers job simpler. There was enough evidence out there to back this claim. With that in mind, here are the evaluation criteria for the ETL engine that we came up with:
|
Criteria |
Apache Nifi |
|
An open-source engine that can be hosted on an EC2 instance or EKS |
Open Source |
|
Out of the box ability to plug in to SQL based data sources such as MySQL |
Yes |
|
Optimized for high throughput and low latency |
Yes |
|
Out of the box ability to load data into SQL based databases, noSQL databases, message brokers, S3 buckets, API end points, other ETL engines or streaming engines |
Yes |
|
Optimum from an operational expense perspective |
Only hosting cost |
|
Supports both batch processing as well as data stream processing |
Yes |
|
Ability to support data science and machine learning at scale in the future |
Yes |
|
Supports the Java programming language |
Yes |
|
Standard security aspects supported |
Yes |
|
Good to have: Ability to function as a data warehouse in itself |
No |
Some of the criteria mentioned above were tailored for our need – such as the ability to extract from MySQL database and the ability to support the Java programming language. Nevertheless, these criteria are inclusive of all the ETL needs irrespective of the technology or the domain in which the ETL solution is being built.
We evaluated several tools and, in the end, Apache NiFi came out on top. The data gathered against each evaluation criteria spoke for itself, and the decision was made.
For the data lake/warehouse, we wanted a cloud native service or a COTS product. The reason was that open-source data warehouses weren’t as scalable when used in a plug and play format. We would have had to do spend a lot of time in tuning and re-engineering the warehouse if we had to take an open source on board. With that, we came up with following evaluation criteria for the data warehouse:
|
Criteria |
Amazon Redshift |
|
Out of the box integration with Tableau, preferably a certified data warehouse for Tableau |
Yes |
|
Should be either a AWS native offering or a warehouse which can be deployed and run on an EC2 instance or EKS |
AWS Native |
|
Out of the box ability to connect to the preferred ETL engine and other sources such as message brokers, streaming engines and other ETL engines as a standard |
Yes |
|
High performance, built specifically for data analytics |
Yes |
|
Optimized for high throughput and low latency data analytics transactions |
Yes |
|
Optimum from an operational expense perspective |
Yes |
|
Supports the Java programming language |
NA |
|
Ability to generate reports as programmed by the business logic |
Yes |
|
Ability to support data science and machine learning at scale in the future |
Yes |
|
Standard security aspects supported |
Yes |
As Fountain was already running on AWS, Redshift trumped all other tools. Once again, the data from the evaluation criteria spoke for itself and made the decision for us.
The big takeaways from this exercise which is useful for any engineer who is developing a BI solution are:
- Focus on getting your data engineering right
- Identify the ETL engine that will help you build an efficient data pipeline. Do this by clearly writing down your evaluation criteria which will help you choose the right ETL engine
- Select a data warehouse/data lake which has been designed only to support business intelligence and data analytics. Do not go with your existing transactional database for this purpose.
- Creating a data lake using the right data warehouse is key. Your data is only going to grow, and your warehouse needs to be able to easily sustain the data growth for the next 10 years
Now that we had our foundational components finalized, we got into execution mode, and this of course had its own challenges.
Our business wanted our retail revenue data as the first dashboard, and we started with a whiteboarding session. Product Management, Engineering, Finance & the Business all sitting together in a room to brainstorm for a few hours – the power of doing these things face to face is immense and we were glad that Covid was on the decline to enable us to do this. It’s important to structure the discussion in the right way so that you come up with the ideal dashboard. If you directly start looking at fancy charts & graphs you are bound to end up with something that’s attractive to look at but is missing most of the important insights you want to derive.
We came up with a structured approach of identifying various data points first. Broadly we had three data points that we wanted to list:
|
Metrics |
These are measurable outcomes which are quantitative in nature. A simple example is your average order value or your revenue PSPD (per store per day). |
|
Dimensions |
These are qualitative measures i.e., what are the different criteria for which you want to view the metrics. A simple example of a dimension is your channel i.e., dine-in, takeaway or delivery. |
|
User Journey |
This is the journey of your dashboard user. Define what they will do when they land on the dashboard. |
The above data points are very useful when you demo the dashboards to your end users. Your users will want the moon, the kitchen sink, a Tesla and a few NFTs – all showing up on the dashboard to reduce their workload and its important that you explain the rationale behind the science of data visualization and analytics. Make them understand that the metrics and dimensions on the dashboard cater to the best user journey.
Once you have the above, your engineering team can work in full gear and come up with the data model. Having a data model setup and finalized as the first step in engineering execution will enable your data engineering team as well as your Tableau team to work independently and converge once the data has been loaded in the lake/warehouse. We followed a de-normalized approach to create our data model. The de-normalized data model caters to the best possible performance. Now, the Tableau team was set to start dashboard development while the engineering team focused on building the data pipe to bring the data into the data warehouse. With Apache NiFi, writing ETL jobs in the language of your choice (in our case it was Java) is a piece of cake. And it indeed turned out to be a piece of cake owing to all the hard work done in preparation to the actual execution exercise.
Within no time, we had the data pipe ready and data flowing into the lake/warehouse. The question was how would one validate the authenticity and accuracy of the data? For a VC funded company, financial integrity is probably the single most important aspect to the survival and growth of the company. We came up with multiple validations steps:
- Our finance team had provided us the algorithms for the data transformation. The obvious first step was for the developer to validate the output against the algorithms provided. This was done for multiple random samples of data.
- Our QA engineering team were ready with their validation and test scenarios. This included data validation steps for multiple use cases and scenarios and steps for validating the accuracy of the ETL jobs.
- Next, we provisioned a ‘one day’ data extract from the new warehouse and our finance team validated this extract against the audited financial reports.
- We followed this up with a ‘one month’ extract from the warehouse which our finance team painstakingly validated.
- Our Tableau developer also validated the data for one month that was populated on the dashboard against the audited financial reports.
- As a final step, random sampling of data on the dashboard for various months across different years were done and the important metrics were verified.
With that we were set. Our journey was complete, and Fountain had another feather in its cap. Often, teams tend to ignore the intricacies of the design and validation of the dashboard and focus only on building the solution. This leads to re-work or even failure of the project. I am hoping that our experience and perspective in coming up with a BI solution will serve as a guide to other businesses and teams that are looking to take up a similar journey